THE STRUCTURE OF A SCIENTIFIC REPORT
HOW TO WRITE A SCIENTIFIC REPORT
Writing a scientific report is like writing a recipe or formula for an experiment.
There are 8 steps in writing a scientific report. Also, keep in mind (and check your school books for) how to draw a scientific diagram, show/tabulate/graph your results.
Step 1. Title
For each experiment there must be a title or heading. Remember to include the date and who conducted the experiment.
Step 2. Aim
There must be an aim stating what this experiment intends to do or find out.
Step 3. Hypothesis
A prediction about what you think is going to happen.
Step 4. A list of equipment or materials
What you use and the quantity of each must be included.
Step 5. Method
Using steps and explain what happened in each step of the experiment. Remember to state how much (quantity) was added to what and where using which apparatus. Include a diagram at the end of the method to show how to set up the equipment or apparatus. This has to be detailed enough for someone else to replicate the experiment.
Step 6. Results
The results and observations of the experiment are recorded here, they can be (preferably) in table, list or paragraph form.
Step 7. Discussion or Analysis
Write down what you discovered about the experiment, including what was difficult or went wrong. The focus of your discussion should be based around what you think your results show about the experiment. You can include ideas for further experiments, an explanation of problems and how to overcome them.
Step 8. Conclusion
A short summary of what was discovered by the experiment. This should be concise and answer the aim.
HOW TO RECORD RESULTS
The data collected should be represented in a way that helps show the existing patterns obtained from the experiment.
Headings should used to pinpoint the important information.
Graphs such as pie graphs, bar graphs and column graphs can be used to represent the information. For linear graphs remember to write the units on the axis, plot the points as crosses (x) to ensure accuracy, instead of connecting the points make sure to draw a line of best fit, helping to predict what may happen next.
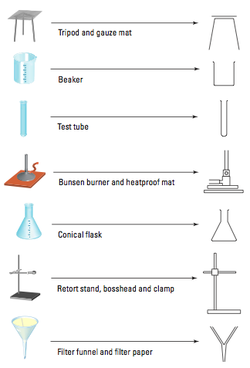
HOW TO DRAW A SCIENTIFIC DIAGRAM
Because it is so difficult to draw clear and easy to understand diagrams, there are a few rules to help you.
- Draw in pencil!
- Use a ruler
- Label the equipment drawn
- Only draw a cross-section of the equipment
Here are some of the most common equipment:
Because it is so difficult to draw clear and easy to understand diagrams, there are a few rules to help you.
- Draw in pencil!
- Use a ruler
- Label the equipment drawn
- Only draw a cross-section of the equipment
Here are some of the most common equipment:
